How the VIX Affects Futures Volatility and What It Means for Your Position Sizing
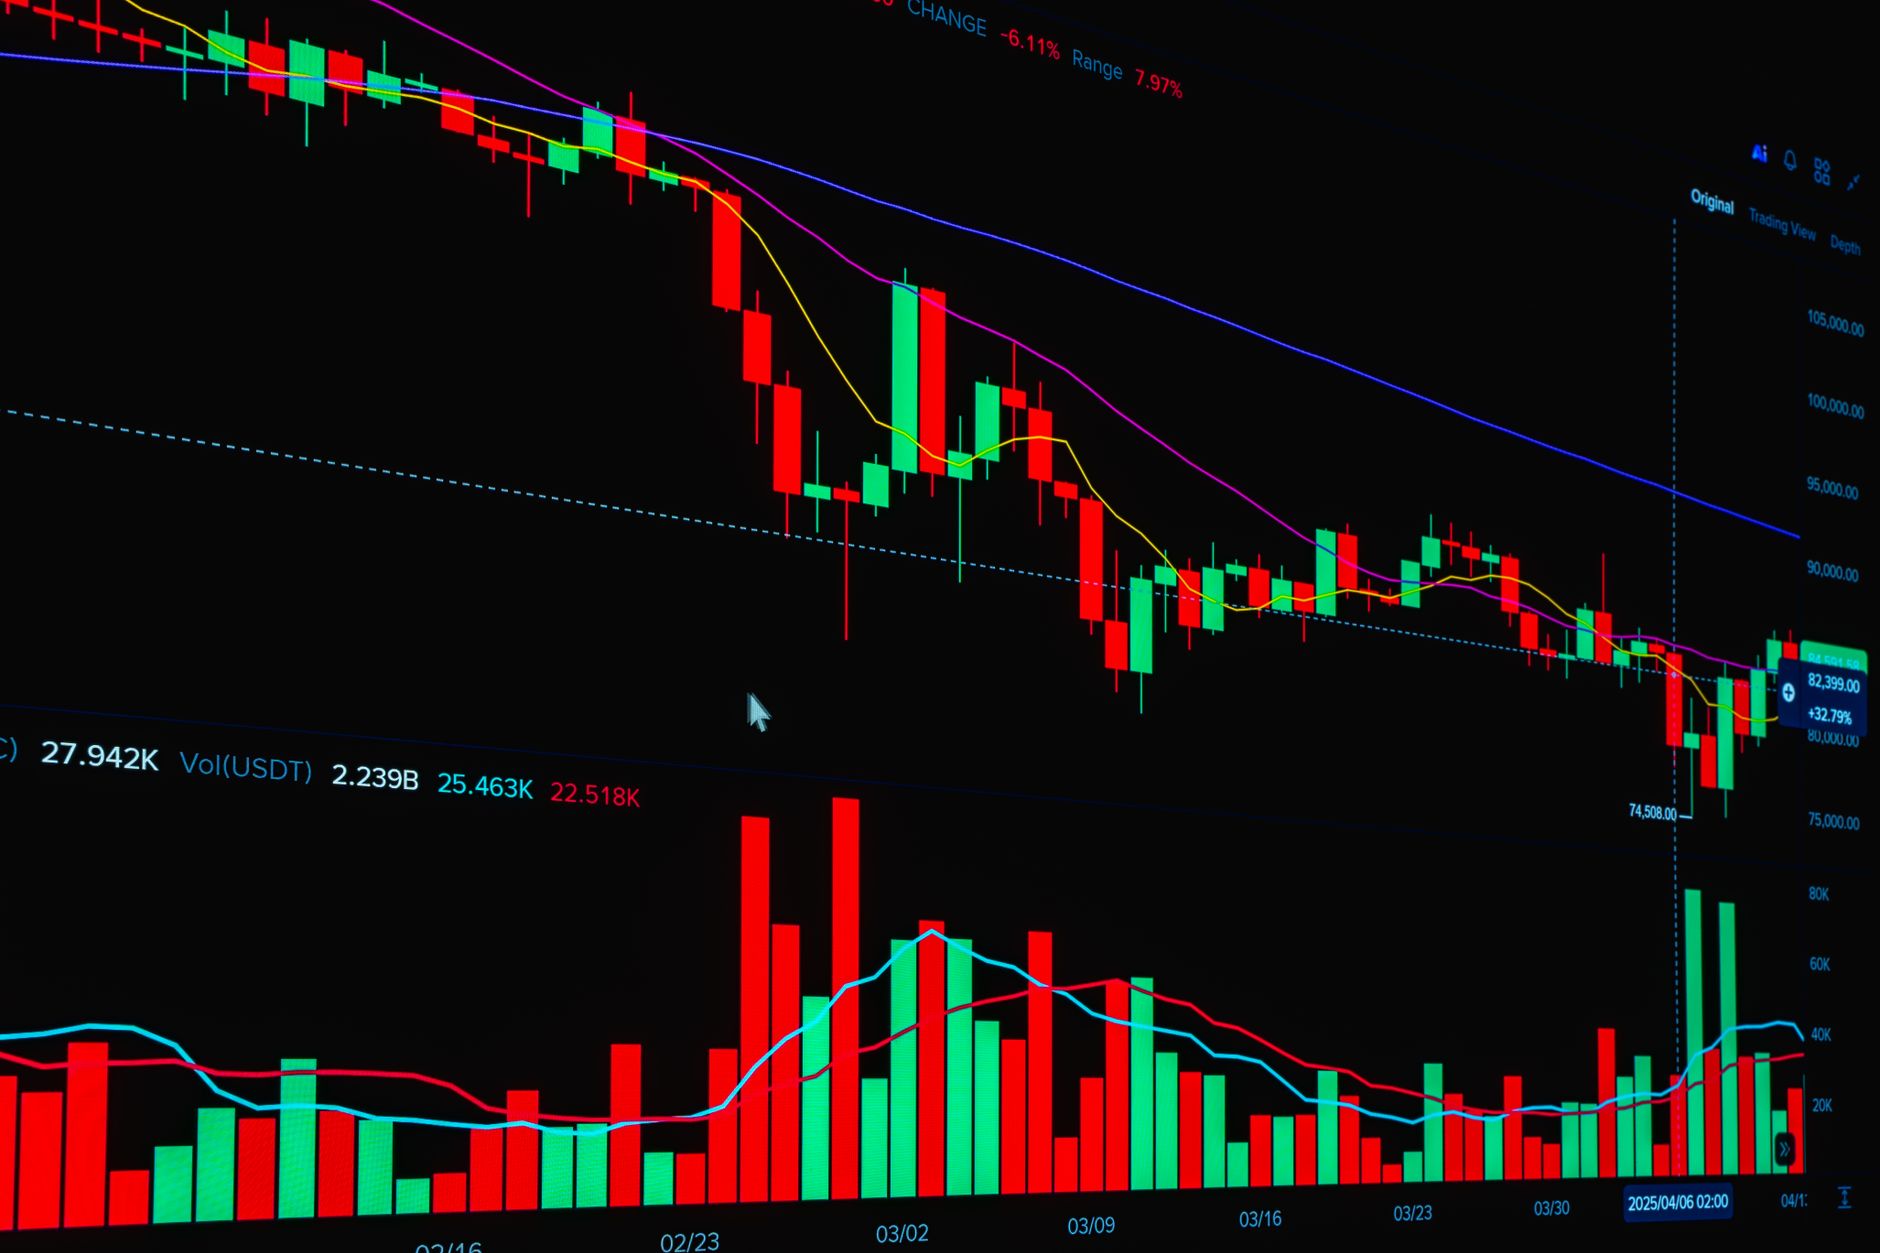
Most articles about the VIX stop at "it's the fear index" and leave you there. That's not wrong, but it's useless if you're actually sizing a futures position. The number that matters to your P&L isn't whether the VIX is "high" or "low" in some abstract sense — it's how that implied volatility reading translates into the dollar range your contract is likely to move today, and how many contracts you can hold without blowing past your risk budget when that range widens. Here's the mechanical version, not the headline version.
What the VIX Actually Measures (And Doesn't)
The VIX is Cboe's calculation of the S&P 500's expected 30-day volatility, annualized, derived from the prices of a strip of SPX options. It is a measure of expected magnitude, not direction. A VIX reading of 20 means the options market is pricing roughly a 20% annualized standard deviation of moves over the next month — in other words, 20 is the implied volatility of the S&P 500 as a whole, backed out of option prices rather than measured from past price action. Nothing in that number tells you whether the move is up or down. The "fear index" nickname sticks because equities fall faster than they rise (vol spikes on selloffs, not melt-ups), not because the index is somehow wired to detect panic. If you trade off the assumption that a rising VIX means "sell," you'll get run over during melt-up rallies that also see vol pick up.
As of early October 2026 the VIX was sitting around 15 — comfortably below its long-run historical average near 19-20. For reference: January 2019 opened at 12.47 with a monthly average of 13.94, a textbook calm regime. Compare that to March 2020, when the VIX averaged 57.74 for the month with an intraday peak of 82.69. Those aren't just different numbers on a chart — they represent roughly a 4-5x difference in expected daily range for every index future you might be holding.
From VIX Level to Actual Dollar Risk: The ATR Bridge
The VIX itself isn't denominated in futures points, so you can't plug it directly into a position-sizing formula. What you actually need is Average True Range (ATR) on the instrument you're trading, converted to dollars. If ES has a 14-day ATR of 40 points and each point is worth $50, your dollar volatility per contract is $2,000 a day. That's the number that determines contract count, not the VIX headline.
That said, VIX and ATR move together closely enough to use VIX as a fast regime check before you even open your platform. A rough rule used by index futures traders: VIX above 25 generally lines up with ATR readings on ES/NQ/YM/RTY that are 1.5-2x their calm-regime values, meaning the same dollar risk budget buys you roughly half the contracts. VIX below 15 tends to coincide with compressed ranges where the formula allows more size for the same risk. Neither threshold is a hard rule — they're a sanity check, not a signal.
The sizing math itself is simple once you have dollar volatility: Position Size = Risk Per Trade (in $) ÷ (ATR in points × point value × your stop multiple). If you risk $500 per trade with a 1.5x ATR stop and ES ATR is at 40 points ($2,000/contract), your stop distance is 60 points = $3,000, so you're sized at roughly 0.17 contracts — meaning in practice you'd trade a micro (MES) instead, or widen your risk budget. That $500 figure itself should come from a fixed percentage of account equity (commonly 0.5%-2% per trade), not a flat dollar number you picked once and never revisited as the account grows or shrinks. Run that same formula when ATR expands to 70 points during a VIX-25+ regime and your position size drops by almost half for an identical dollar stop.
Why Most "VIX and Position Sizing" Content Oversimplifies This
A lot of retail-facing content treats this as "VIX high = trade small, VIX low = trade big" and stops there. Three problems with leaving it at that:
- VIX is an S&P-specific number. It's derived from SPX options, so it's a reasonable regime proxy for ES/MES and loosely correlated with NQ/RTY, but it says nothing directly about crude oil, gold, or bond futures volatility. Those instruments have their own implied vol measures (OVX for crude, GVZ for gold) and can decouple from equity vol entirely — crude ripped in backwardation-driven supply shocks while the VIX sat under 15.
- The VIX is forward-looking and mean-reverting, your ATR is backward-looking. A VIX spike from 15 to 28 overnight on a headline event will show up in options pricing immediately, but your 14-day ATR won't catch up for several sessions. That lag means ATR-only sizing can leave you oversized exactly when a shock just hit — which is why cross-checking against the current VIX level, not just trailing ATR, matters as a same-day adjustment.
- Term structure matters more than the spot print. VIX futures normally trade in contango (further-dated contracts priced higher than spot, reflecting the market charging extra for longer-dated uncertainty). When that structure inverts into backwardation — front-month VIX futures trading above the back months — it signals the market expects elevated near-term stress to fade, which has historically coincided with some of the sharpest short-term volatility spikes (2008, March 2020, August 2024). A spot VIX reading without checking whether the curve is in backwardation misses the information embedded in how urgent the market thinks the current stress actually is.
A Practical Workflow
Before sizing a trade on an index future: pull the current VIX level and compare it to its 20-day average to see if you're in an expanding or contracting vol regime. Check the term structure — is front-month backwardated against the next contract, suggesting near-term panic pricing, or is it in normal contango? Then run your actual position-sizing formula off the instrument's own ATR, not the VIX number directly, and treat the VIX reading as a same-day override if it has moved sharply since your ATR was last calculated. A VIX print under 15 doesn't mean "size up blindly" — it means your backward-looking ATR is probably still a fair representation of near-term risk. A VIX print that gapped from 16 to 24 overnight means your ATR is stale and you should size as if the wider range is already here, because by the time ATR reflects it, you'll have taken several sessions of outsized risk on old sizing.
One more caveat worth flagging if you're tempted to trade VIX futures or VIX ETPs directly as a volatility hedge rather than just reading the spot index: a VIX future gives you vega exposure (exposure to the volatility of the underlying asset), not delta exposure to the S&P 500 itself, and its price reflects the market's forward implied volatility between now and the contract's expiration date. Because VIX futures normally sit in contango, holding long VIX exposure through expiration tends to bleed value through negative roll yield even when realized volatility stays flat — part of the broader volatility risk premium that sellers of volatility collect over time. That's a separate trade from position sizing on ES or NQ, but it explains why "just buy VIX calls when you expect a selloff" is a much more expensive and leaky hedge than traders assume going in.
None of this requires a model. It requires checking one extra number before you place a trade and understanding what it actually represents instead of trading off a headline that says "fear index spikes."